Sandlapper Journal
New Flood Zone Maps
The update was not just a change in colors. It was a change in how flood risk would translate into insurance, building rules, renovation plans, and buyer expectations.
What changed
The county was replacing a 2004 baseline with a more refined flood model. In Charleston, that is not clerical. It can affect monthly payments, renovation plans, and the questions a buyer needs to ask.
The map change
Before / After
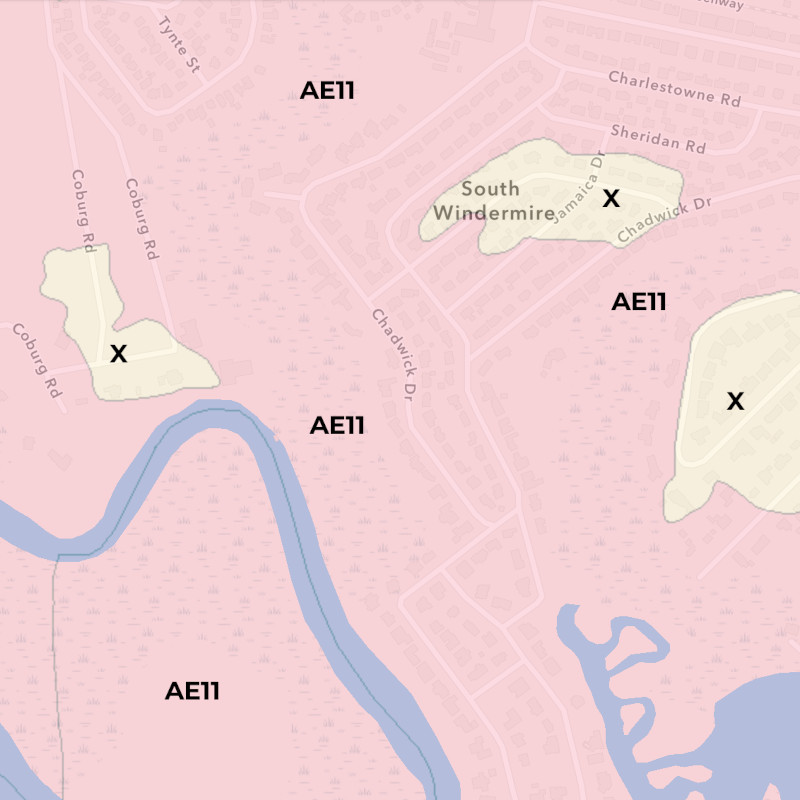
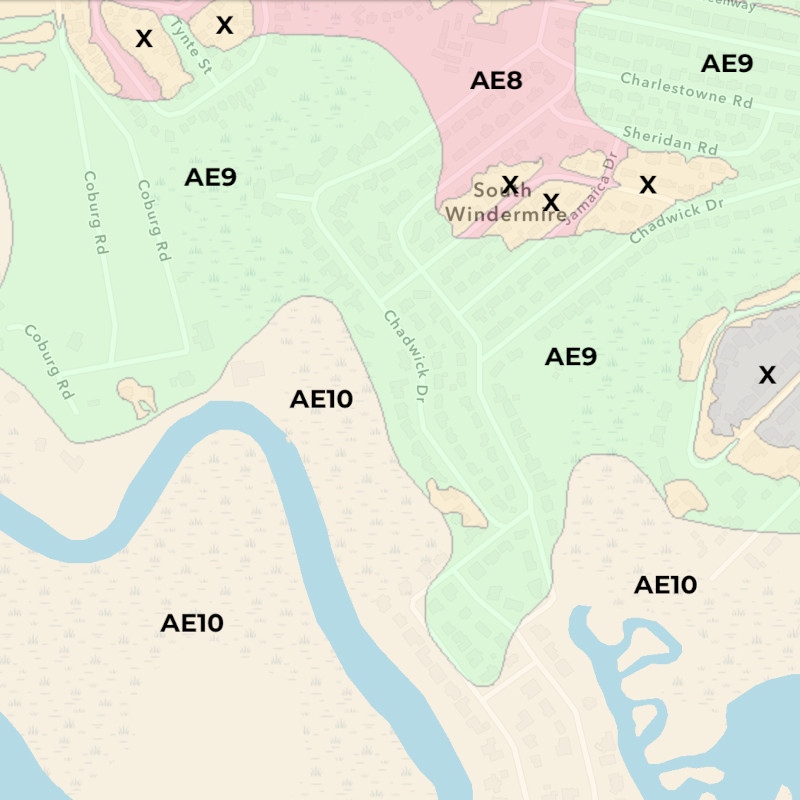
Same general stretch of coast, different model. The land did not change overnight. The interpretation of flood exposure did.
Before
2004 working baseline
After
2021 revised maps
The practical point
A changed zone label was never the whole story. It was a better starting point for asking what the house, street, elevation, and insurance quote were trying to tell you.
The 2020 moment
The Update
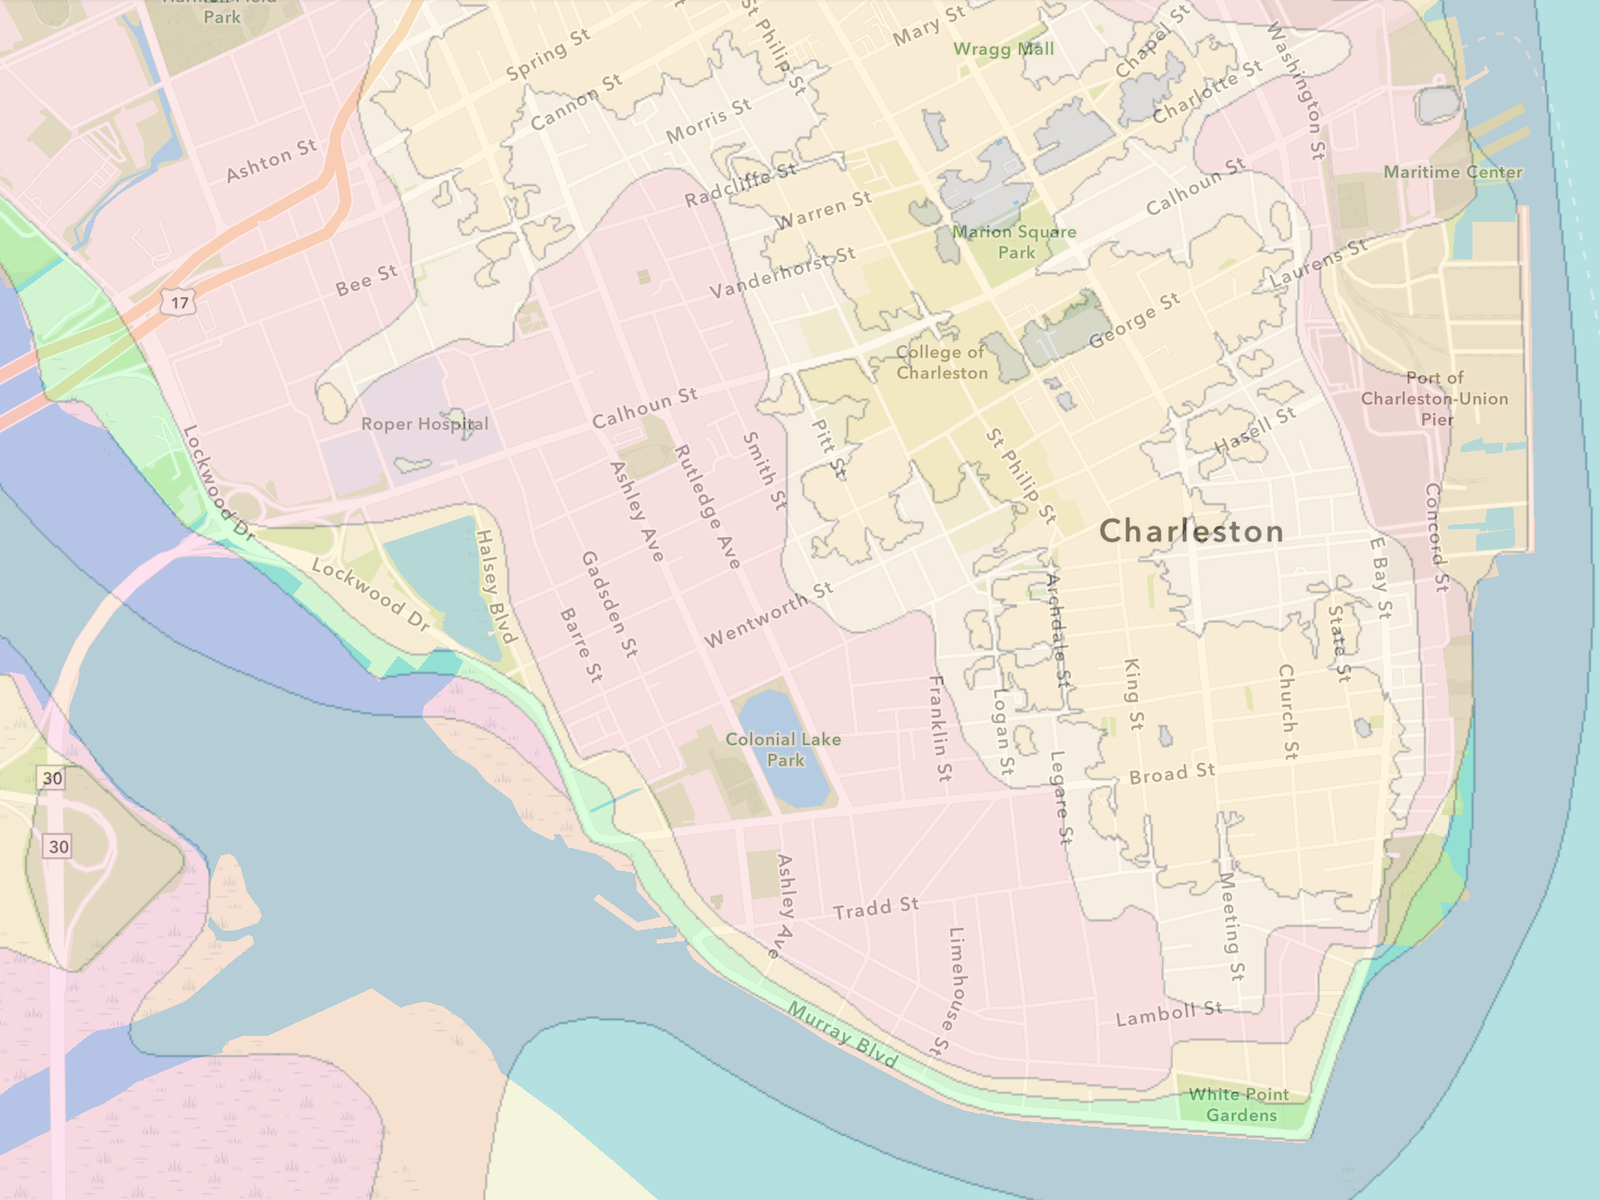
At long last, and with much anticipation, the Lowcountry was preparing for a substantial update to its flood zone maps.
During nearly five years of review, FEMA, Charleston County, and the South Carolina Department of Natural Resources analyzed a mountain of flood data from vulnerable areas, sometimes at a level that felt nearly parcel by parcel.
Flood maps sit at the intersection of mortgage underwriting, insurance pricing, and local building regulation. In Charleston, that is not a clerical detail. It is one of the places where a buyer’s monthly payment, renovation plans, and appetite for risk all politely collide.
That does not mean the new maps answer every question. A map can tell you a great deal about a mapped hazard. It cannot tell you whether the crawlspace has been neglected, whether the street drains well after a July thunderstorm, or whether a previous owner treated water intrusion as a charming seasonal guest.
Map context
2004 → 2021
2004Earlier Charleston County maps became the working baseline.
5 yearsThe update went through a long technical review.
2021The revised maps were expected to become effective.

A better model for flood zones
The Model
The old maps leaned heavily on storm-surge modeling, especially the sort of hurricane scenario that properly gets everyone’s attention. That is obviously relevant. It is also not the only way Charleston floods.
A summer rainstorm, a backed-up drainage system, a high astronomical tide, a persistent onshore wind, and a tropical system can all produce water problems. They do not all behave the same way, and they do not all tell you the same thing about a house.
The newer maps attempted to incorporate improved data from recent storms, rainfall, tidal influence, and revised flood elevations. That was the point of the exercise: not to make Charleston look scary on paper, but to make the paper less wrong.
The practical implication
The Shift
The new maps were expected to affect tens of thousands of Charleston County properties, but the effect was not one-directional. Some properties would be escalated into higher-risk categories. Many others would be mapped as lower risk than before.
That is the part that deserves a quieter reading. A lower-risk designation does not mean water becomes theoretical. A higher-risk designation does not automatically make a home a bad purchase.
Some moved higher
Higher mapped risk
Homes newly placed into a higher-risk category may face lender-required flood insurance, higher premiums, or stricter renovation and building considerations.
Many moved lower
Lower mapped risk
Some homes previously treated as higher-risk may see relief, especially where old maps overstated exposure or failed to reflect better elevation data.
Still true
Lower risk is not no risk. Higher risk is not automatic doom. Charleston remains stubbornly physical. Street behavior, drainage, finished floor elevation, foundation type, and past water history still matter as much as they did before.
Insurance was the buyer-facing consequence
Insurance
For homeowners, the map update was not merely academic. The maps influence whether flood insurance is required, how flood elevations are understood, and how buyers model the cost of ownership.
Some homes were likely to become more expensive to insure. Others were likely to see relief. That is not a contradiction; it is the expected result of replacing a rougher model with a more precise one.
The useful response in 2020 was simple enough: do not treat the flood-zone label as a verdict. Get the quote, read the elevation information, and understand the building before barrelling towards closing week.
Useful number
Get the Quote
A seller’s existing bill or an MLS listing field is not a policy quote. Get a quote for the property as it will actually be owned.
What did not change
The Property
The updated maps gave buyers a better tool. They did not make flood risk simple. That distinction is the whole point.
There will be homes that look riskier on paper than they are in practice. There will also be homes that look comfortable on a map while sitting in a drainage pattern that only locals seem to know about.
For a smart buyer, the new flood maps should create neither alarm nor complacency. They should create a better set of questions.
The Point of the Matter
“The map is official. The property is physical. You need both.”

Continue reading
Read Next
Use this journal post for historical context. Use the guide for present day flood insurance decisions.
Charleston Livability
Flood Insurance Guide
Charleston Livability